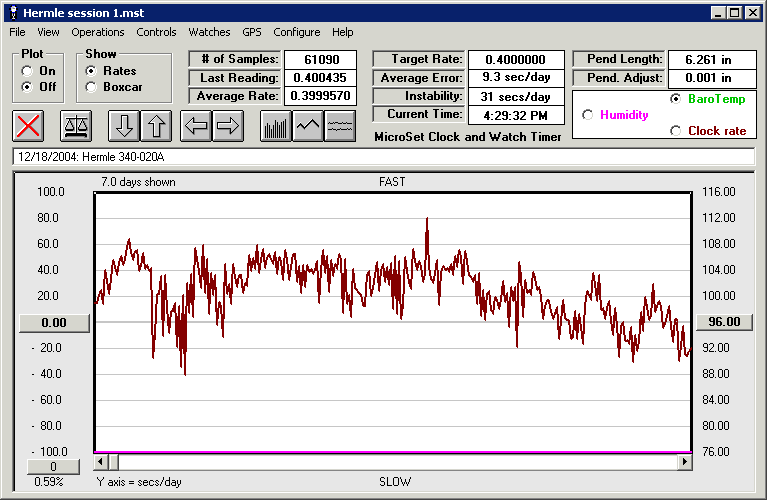
The following graphs indicate how the rate changes in a new Hermle 340-020 floating balance movement over the week that it runs. The first graph shows the very first run of this movement. The middle line of the graph is a perfect rate would be (a rate error of zero). Each grid line represents 20 seconds of error per day. This movement tended to be fast most of the week, but was pretty inconsistent. Several times it ran slow. It would be hard to regulate this movement and be anywhere close to correct.

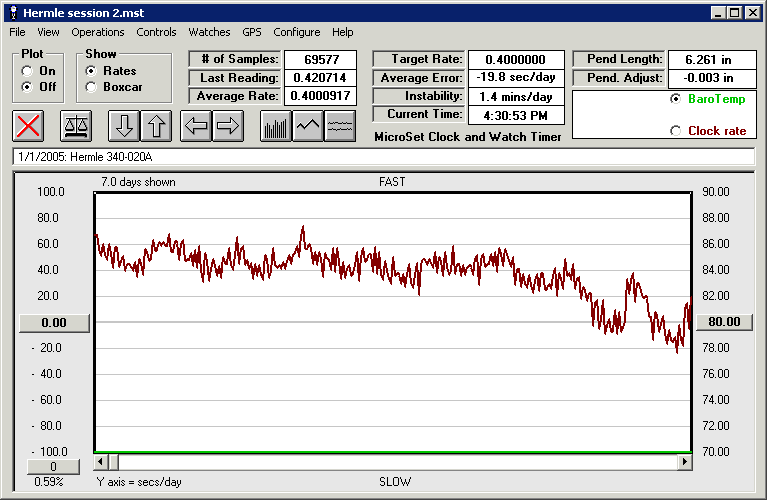
The following graph shows the same movement on it’s second week. It’s much more consistent now. The rate was relatively stable for five days and then began to slow down. By the sixth day it was running nearly correctly.

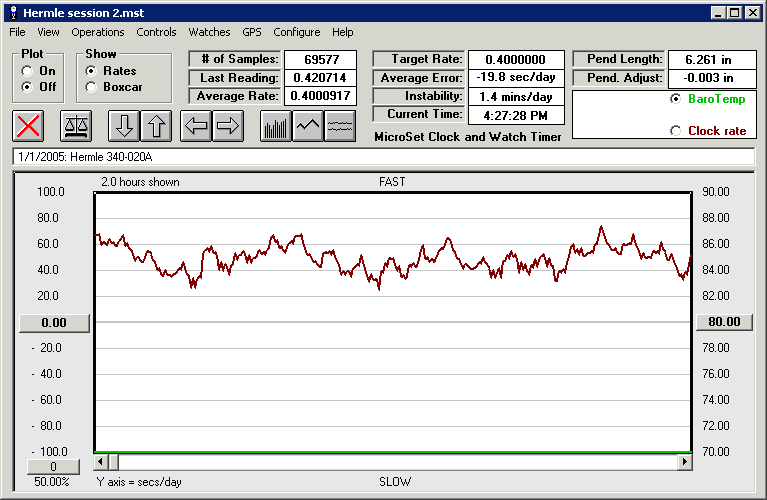
The following graph shows the rate of the clock over a two hour period at the beginning of its second week. As you can see, it still varies between 25 seconds per day fast and 65 seconds per day fast. The conclusion you might draw is that, to measure an accurate average rate for this clock, you would have to measure it for at least an hour. This could be done with the MicroSet computer interface software as we have done here, or with the Running Average function in MicroSet 3. The computer software would be better because it would reveal any errors in the readings. The Running Average might make an erroneous reading and skew the result, but you wouldn’t know.
Capturing the rate with an acoustic sensor also invites errors because the striking mechanism will introduce false readings. But the standard optical sensors are hard to use with the floating balance. I used a special reflective optical sensor for these readings that measures a black mark on the balance wheel. This sensor is available by special order.

