MicroSet can be connected to your Windows-based personal computer to give you much more information about how a clock or watch is running. MicroSet outputs data to a computer serial port. This is also known as a COM port. If your computer has no COM ports and only has USB ports, you also need a USB to serial adapter cable. You can buy this locally or from us (see the order form).
Macintosh users — We no longer write a special version for Macintosh because there was very little request for it. Modern Macs can run Windows under the Parallels Desktop program. We run our Windows programs under Parallels Desktop and they work fine.
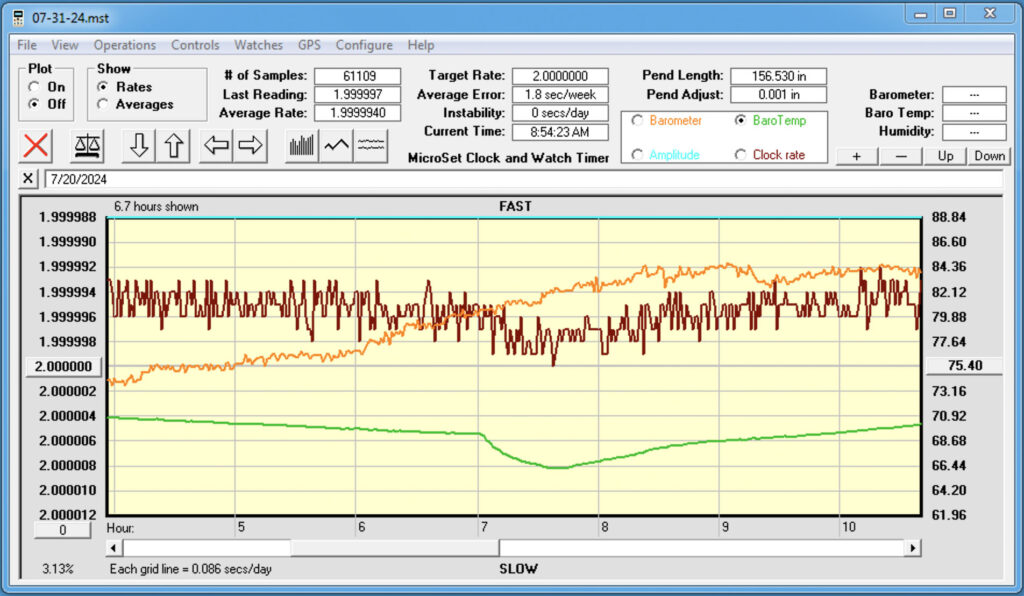
Seen below is the screen of the MicroSet interface program version 3 for Windows (compatible with Windows XP through Windows 11).
The graph area shows a history of beat readings of a clock. This particular graph represents an unusual setup. MicroSet is measuring single beats at the escape wheel. It shows us that the wheel is eccentric and speeds up and slows down dramatically with each rotation.
- The beat times are labeled at the left of the graph, with the center at 8000 BPH.
- The numbers above the graph show us that we have collected 250 readings and the average rate is 7993.315 BPH.
- The “Target Rate” is set to 8000.000. This value is entered by the operator, and is the correct rate for this movement.
- The “Average Error” of -1.2 mins/day is calculated by comparing the “Target Rate” with the current “Average Rate” and tells us that the movement is running slow by this amount.
- The “Instability” is a parameter that evaluates the consistency of the movement …. how well it keeps to a steady rate. This can be used to judge how well a clock is running.
- MicroSet calculates the correct length of the pendulum from the value entered for “Target Rate” and shows this to you at the top of the screen. Below this it shows you how far you must move the pendulum bob to get the clock to run at the correct rate. On this clock, the bob must be moved up .013 inches to correct the losing rate of 1.2 minutes per day.
Other controls let you zoom in on parts of the data, scroll through the history of readings, display running averages or moving averages, etc. When used with atmospheric sensors, the graph has several additional controls. To see an image of the full screen with sensors, click here.
We have installed a copy of the Windows software to monitor a tower clock, with atmospheric sensors, in the Santa Barbara County Courthouse. To see a live update on the software running on this clock, click here.
The following illustration shows the MicroSet interface software version 3 measuring a watch as a simulation of paper tape timers.
There are three versions of the software program available for Windows computers. Version 2 is the basic program for clock work. Version 3 has expanded features to support watch functions. A special enhanced version is included with the MicroSet Watch Timer Pro.
The software will run under all versions of Windows from 95 to Windows 10. We no longer offer a version for Macintosh computers, but you can run the Windows versions under Virtual PC for Macintosh.
Versions 2 and 3 of the computer interface have essentially the same screen appearance and functions. They differ in the commands that are available under the Menus.
The following table lists the Menu commands available in MicroSet Interface Version 2 program:
File Menu
Open – Open a previously saved data file
Save – Save the current data file
Save As – Save the current data file with a new name
Save A Subset As – Save a portion of the data set (to reduce file size)
—–
Print – Print the current data graph
—–
Exit – Exit the program
View Menu
Fit in Window – Fit the data graph within the current window size
Expand to 100% – Expand the data graph to 100% scale
Setup Sensors and Amplitude – Setup the graph to display atmospheric sensor data or amplitude of swing
Show / Hide gridlines – Show or hide the gray gridlines in the graph
Large comment window – Increase the size of the comment window at the top of the graph
—–
Show Seconds Per Beat – Show rate as Seconds Per Beat to six decimal places
Show Beats Per Hour – Show rate as Beats Per Hour to two decimal places
Show Error Per Day – Show rate in terms of seconds per day of error rather than absolute value
Show microseconds – Show rate as a deviation in microseconds
Show milliseconds – Show rate with a resolution of milliseconds
Show pendulum amplitude – Monitor the amplitude of pendulum swing rather than rate
Show Rate Finder – Display the hourly counts from the optional Rate Finder Mode
Show Raw Data – Display raw data in several different formats
Operations Menu
Running average – Display a running (cumulative) average rate
Boxcar average – Display a “boxcar” (or “moving”) average of rate
Difference / Rate of change – Display amount of change between each sample as a value
Percentage change – Display amount of change between each sample as a percentage
Gain/Loss – Display the data as the number of seconds gained or lost over time
Instability history – Display a history of the Instability readings over time
Remove noise – Convert each data point that extends above or below the window to the average value of its two neighbors
—–
Pre-average new data – Pre-average several data samples into one
Skip samples – Skip a number of data samples before one is stored
—–
Modify datasets – Add or subtract values to the data (to correct drift or normalize)
Exchange data sets – Exchange the Main data array with the Average data array
Change timestamps – Correct the time stamp of samples from the Data Capture option
Controls Menu (reproduces certain actions also available as icons in the window)
Plot On – Start capturing data
Plot Off – Stop captuyring data
Show Rates – Display the main data set
Show Averages – Display the alternate data set
Refresh display – redwarw the current display
Recalculate average – recalculate the average rate
—–
Delete all data – Empty the program of all current data
Autoscale – Adjust the scale of the Y axis so all data firs on the screen
Reduce vertical scale – Make the Y axis more coarse
Move down – Shift the data downward
Increase vertical scale – Make the Y axis more fine
Move up – Shift the data upward
Halve horizontal scale – Divide the horizontal scale by two
Reduce horizontal scale – Reduce the horizontal scale by one unit
Double horizontal scale – Expand the horizontal scale by a factor of two
Expand horizontal scale – Increase the horizontal scale by one unit
Bar graph – Display the data as vertical columns
Line graph – Display the data as a single line
GPS Menu
Show drift – Used with the optional GPS interface to normalize the drift readings
Convert to rate – Used with the optional GPS interface to convert drift to rate
—–
Monitor receiver status – Display the number of satellites observed by the option GPS Reference Receiver
Configure Menu
AutoSave – Set up the program to automatically save the data at regular intervals
Setup – Specify which serial port to use
Window size – Specify the size of the program window in pixels
The following table lists the additional commands available in the MicroSet Version 3 interface program:
Version 3 adds features for watches. It is also more reliable for use with modern versions of Windows. There have been no updates to version 2 of the software in many years.
Watches Menu
Paper tape simulation – Show the rate as a graphical simulation of paper tape watch timers
Accutron rate – Show the rate of tuning fork watches as frequency
Analyze tick sound – Graphical display of watch tick sounds and balance amplitude
Balance Wheel Amplitude – Improved graphical display of watch tick sounds and balance amplitude
The last version of the Windows interface software is version 4. It adds some useful features to the display screen and is more reliable with Windows 10 and 11.
Version 4 adds vertical time lines to the graph display so you can see when events occurred. New Menu functions allow you to concatenate or compare files, save a screenshot, show the average with the raw rate data, and calculate Q. Version 4 is included with the purchase of version 3.