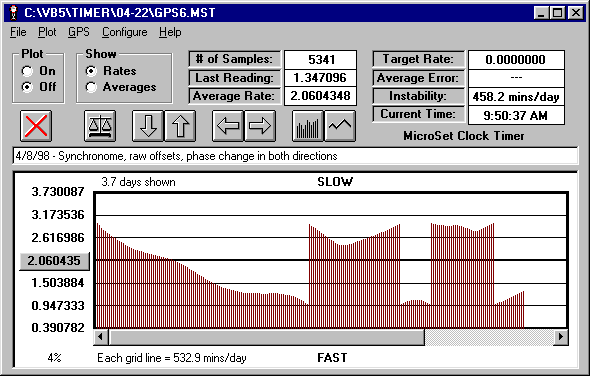
The following graphs represent the use of the GPS Mode in the MicroSet Clock Timer. The clock in this example is a Synchronome. The first graph shows the raw data. Every 60 seconds a reading is taken that is the offset from the Sycnhronome tick to the reference tick. If the clock under study is slow, this offset will gradually get longer. If the clock is fast, the offset will get shorter. The raw data records the drift in the clock from a true rate.
You will see four radical jumps in the raw data. These are times when the clock tick comes into phase with the reference pulse.
Generally, this clock had a gaining rate. At the beginning of the graph you will see the offset times getting shorter as the clock gains on the reference pulse. In the middle of the run, seen below the word SLOW on the graph, I removed 2 weights from the weight tray and caused the clock rate to reverse and slow down. After this point the offset begins to climb, though the trend is rather obscured by three large jumps as the clock came into phase with the reference pulse.

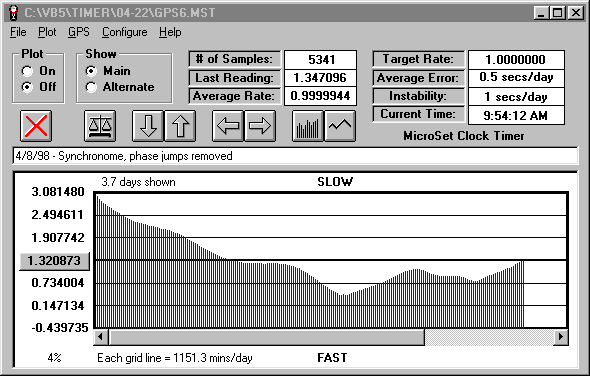
The first step in making use of the data is to remove the phase jumps. This is handled automatically by a command in the MicroSet interface software (note the GPS menu between PLOT and CONFIGURE). The following graph shows the offset times with the phase jumps removed. You can more easily see that the increasing rate was reversed under the word SLOW at the top of the graph. The graph now shows the total drift in the clock over the measurement interval.

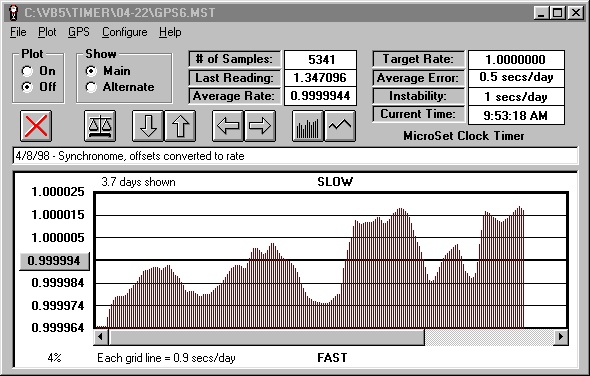
MicroSet will also convert the drift data into rate readings. This is handled like a “boxcar” average, where you specify a span of samples and the program divides the total drift over that span by the total time of the span. The graph below shows the Synschronome rate with a span of 100 samples. In other words, each data point represents the average rate for the previous 100 minutes. The rate seems erratic for a Synchronome, but that’s how this one is running.

